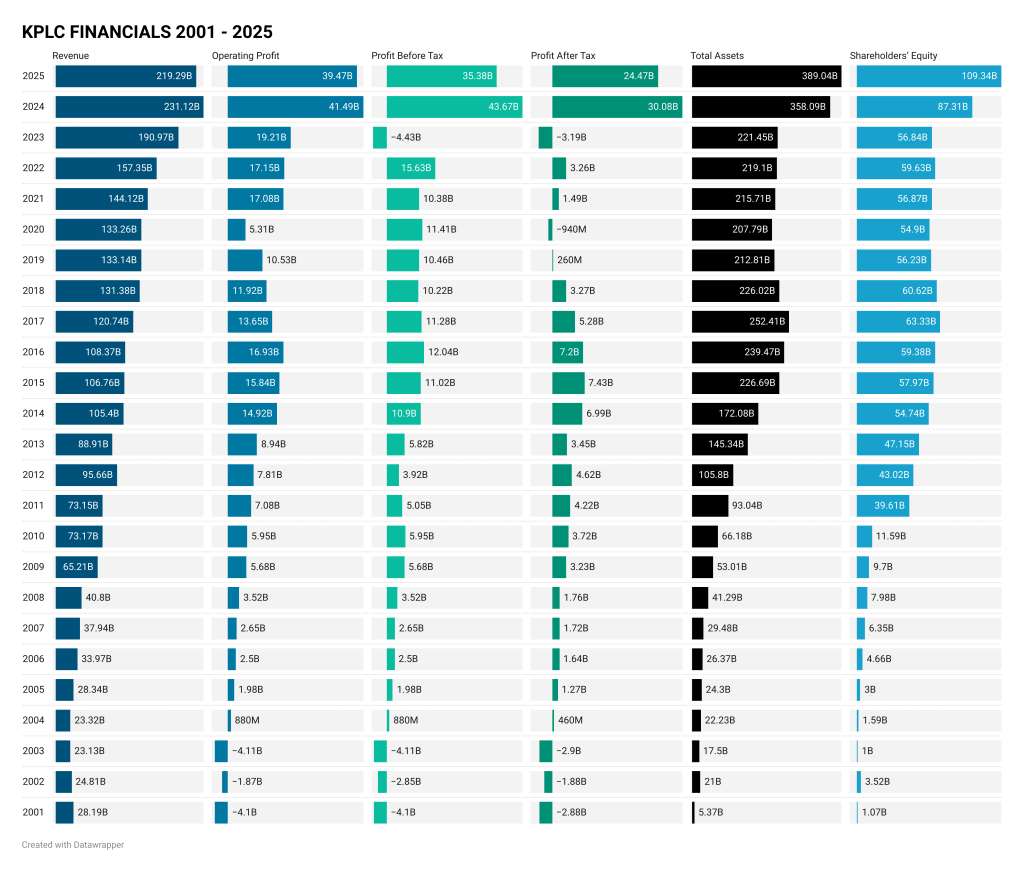
Kenya Power’s net profit has dropped 18.7% to KSh 24.47 billion, while profit before tax fell KSh 35.38 billion from 43.67 billion, mainly due to the absence of one-off forex gains recorded the previous year.
- •Revenue declined 5.1% to KSh 219.29 billion, marking the first year-on-year fall since 2013, as lower foreign-exchange recoveries and moderated tariffs offset higher electricity sales.
- •The earnings retreat on the back of an exceptional 2024, when profit after tax hit KSh 30.08 billion on strong forex gains and tariff adjustments.
- •Despite the decline, FY2025 profit remained at least three times higher than any year before 2024, underlining the company’s sustained recovery in cost efficiency, liquidity, and balance-sheet strength.
Over the past two decades, Kenya Power’s revenue has risen sevenfold to KSh 219 billion, while profit after tax has climbed from under KSh 2 billion in the early 2000s to KSh 24.5 billion in 2025.
During the same period, total assets expanded from about KSh 5 billion to KSh 389 billion, reflecting consistent investment in infrastructure.
For real time market updates and analysis, join our WhatsApp Channel.Financial Highlights (KSh Billions)
| Metric | FY2025 | FY2024 | YoY Change |
|---|---|---|---|
| Revenue | 219.29 | 231.12 | 🔴 ▼ 5.1 % |
| Cost of Sales | 144.66 | 150.61 | 🟢 ▼ 3.9 % |
| Gross Margin | 74.62 | 80.52 | 🔴 ▼ 7.3 % |
| Operating Profit | 39.47 | 41.49 | 🔴 ▼ 4.9 % |
| Profit Before Tax | 35.38 | 43.67 | 🔴 ▼ 19.0 % |
| Profit After Tax | 24.47 | 30.08 | 🔴 ▼ 18.7 % |
| Total Comprehensive Income | 23.36 | 30.47 | 🔴 ▼ 23.4 % |
| Total Assets | 389.04 | 358.09 | 🟢 ▲ 8.6 % |
| Shareholders’ Equity | 109.34 | 87.31 | 🟢 ▲ 25.2 % |
| Non-current Liabilities | 162.28 | 165.28 | 🟢 ▼ 1.8 % |
| Current Liabilities | 117.43 | 105.49 | 🔴 ▲ 11.3 % |
| Net Cash from Operations | 39.77 | 28.37 | 🟢 ▲ 40.2 % |
| Closing Cash & Equivalents | 7.69 | 10.35 | 🔴 ▼ 25.7 % |
Revenue and Operations
Finance costs rose to KSh 4.72 billion, reversing a KSh 683 million net gain in 2024.
Operating cash flows strengthened 40 percent to KSh 39.77 billion, supporting continued capital investment and partial debt repayment.
- •Electricity sales grew by 887 GWh during the year, supported by network reliability and new customer connections.
- •The decline in revenue stemmed from reduced forex recoveries and a partial roll-back of tariff adjustments introduced in 2023.
- •Average system efficiency improved to 78.79 percent from 76.84 percent, reflecting lower technical and commercial losses.
- •Operating expenses dropped KSh 3.86 billion, driven by lower credit-loss provisions under IFRS 9 and tighter cost controls.
- •Power-purchase expenses eased KSh 5.94 billion after the Kenya shilling stabilized, reducing the forex impact on energy costs.
Balance Sheet Strength
- •Total assets rose 8.6 percent to KSh 389.04 billion, reflecting ongoing grid investment and higher current assets.
- •Shareholders’ equity climbed 25 percent to KSh 109.34 billion, placing Kenya Power in the country’s KSh 100 billion equity tier for the first time.
- •Non-current liabilities eased 1.8 percent to KSh 162.28 billion, while the working-capital deficit narrowed as receivable collection improved.
- •The company invested KSh 29.6 billion in network modernization, substations, and automation projects, up from 24.9 billion the prior year.
The stronger equity position reflects sustained profit retention and lower foreign-currency debt exposure.
Long Term Record

Shareholders’ equity grew from barely KSh 1 billion in 2001 to over KSh 109 billion in 2025, underscoring a transformed capital structure. The company’s asset-to-equity ratio improved sharply, signaling stronger solvency and reduced leverage.
The board declared a final dividend of KSh 0.80 per share, following an interim payout of KSh 0.20, bringing the total dividend to KSh 1.00 per share. Payment is scheduled for 30 January 2026 to shareholders on record by 2 December 2025.
.png?key=small-avif)
